




Upwork automation rates can help you research a quote, but an advertised budget is not money earned. Redwater Revenue’s October 2026 data reports a $30 median among 648 numeric hourly rates. Those rates are posted maximums, according to the publisher’s methodology. They are not verified contract rates or Nigerian freelancer earnings.
The sample boundary matters just as much as the headline. Those 648 observations represent 39.2% of 1,653 captured unique postings mentioning the report’s core automation platforms. A separate count of 65 postings at $75 or more becomes 3.93% of all captured postings or 10.03% of the numeric-rate sample. Both calculations use the same numerator. Neither measures your chance of winning work.
This guide checks those definitions, shows the calculations and supplies a blank quote worksheet. It also uses a clearly fictional project to show how charges and unpaid hours change a contribution-per-hour calculation. No proposal was submitted, contract won or receipt observed for this exercise.
What the October Upwork automation rates sample covers
Redwater Revenue’s report is independent research, not an official Upwork publication. Its release feed dates the October edition to 1 November 2026 at 14:38:31 GMT. October is the observation month; November is the release month. We checked the public files on 7 November.
The report defines its platform set around postings naming Zapier, n8n or Make.com, including the Integromat match phrase. Its methodology describes daily collection through an Apify actor and substring matching in titles and descriptions. Therefore, a platform mention can be incidental. One posting can also mention several platforms.
The publisher’s public JSON reports 1,653 unique postings and a numeric-rate sample of 648. It also reports 567 fixed-price postings. We do not label every observation outside the hourly sample as fixed-price: 1,653 minus 648 equals 1,005, which is larger than 567. The aggregate fields alone do not fully classify that remainder.
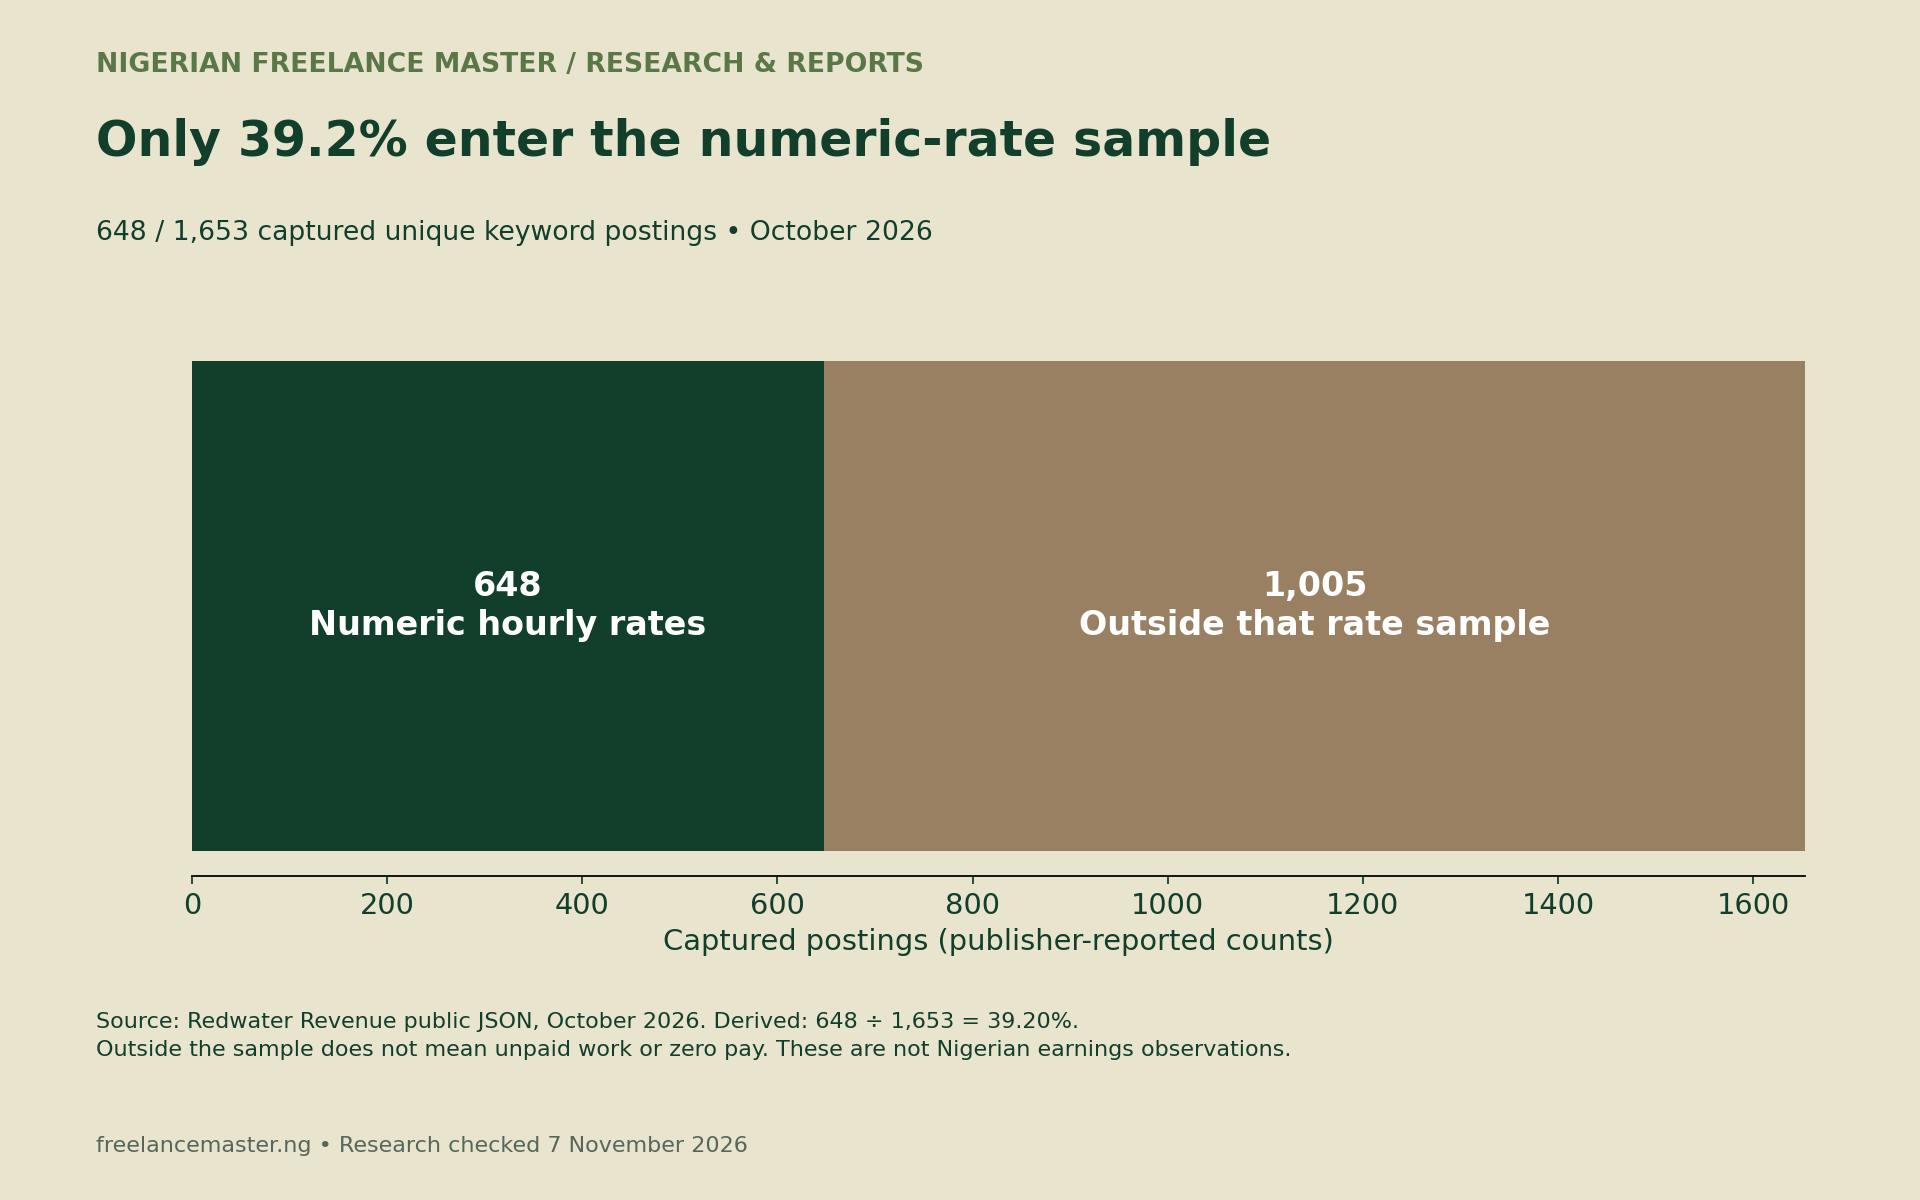
These boundaries prevent a common mistake: treating the median as a summary of all automation work. The collection is not a census of Upwork, all freelance platforms or work available to Nigerians. Keyword matching can miss relevant projects as well as capture marginal ones. No geographic filter in the figures establishes Nigerian eligibility.
The same 65 postings can produce two correct percentages
A percentage needs a named population. Here, the public data file reports 65 postings with a posted hourly maximum of at least $75. Compare that count with the two populations below.
| Calculation | Numerator | Denominator | Result |
|---|---|---|---|
| Numeric-rate coverage | 648 numeric rates | 1,653 captured postings | 39.20% |
| At least $75, against all captured postings | 65 postings | 1,653 captured postings | 3.93% |
| At least $75, within the numeric-rate sample | 65 postings | 648 numeric rates | 10.03% |
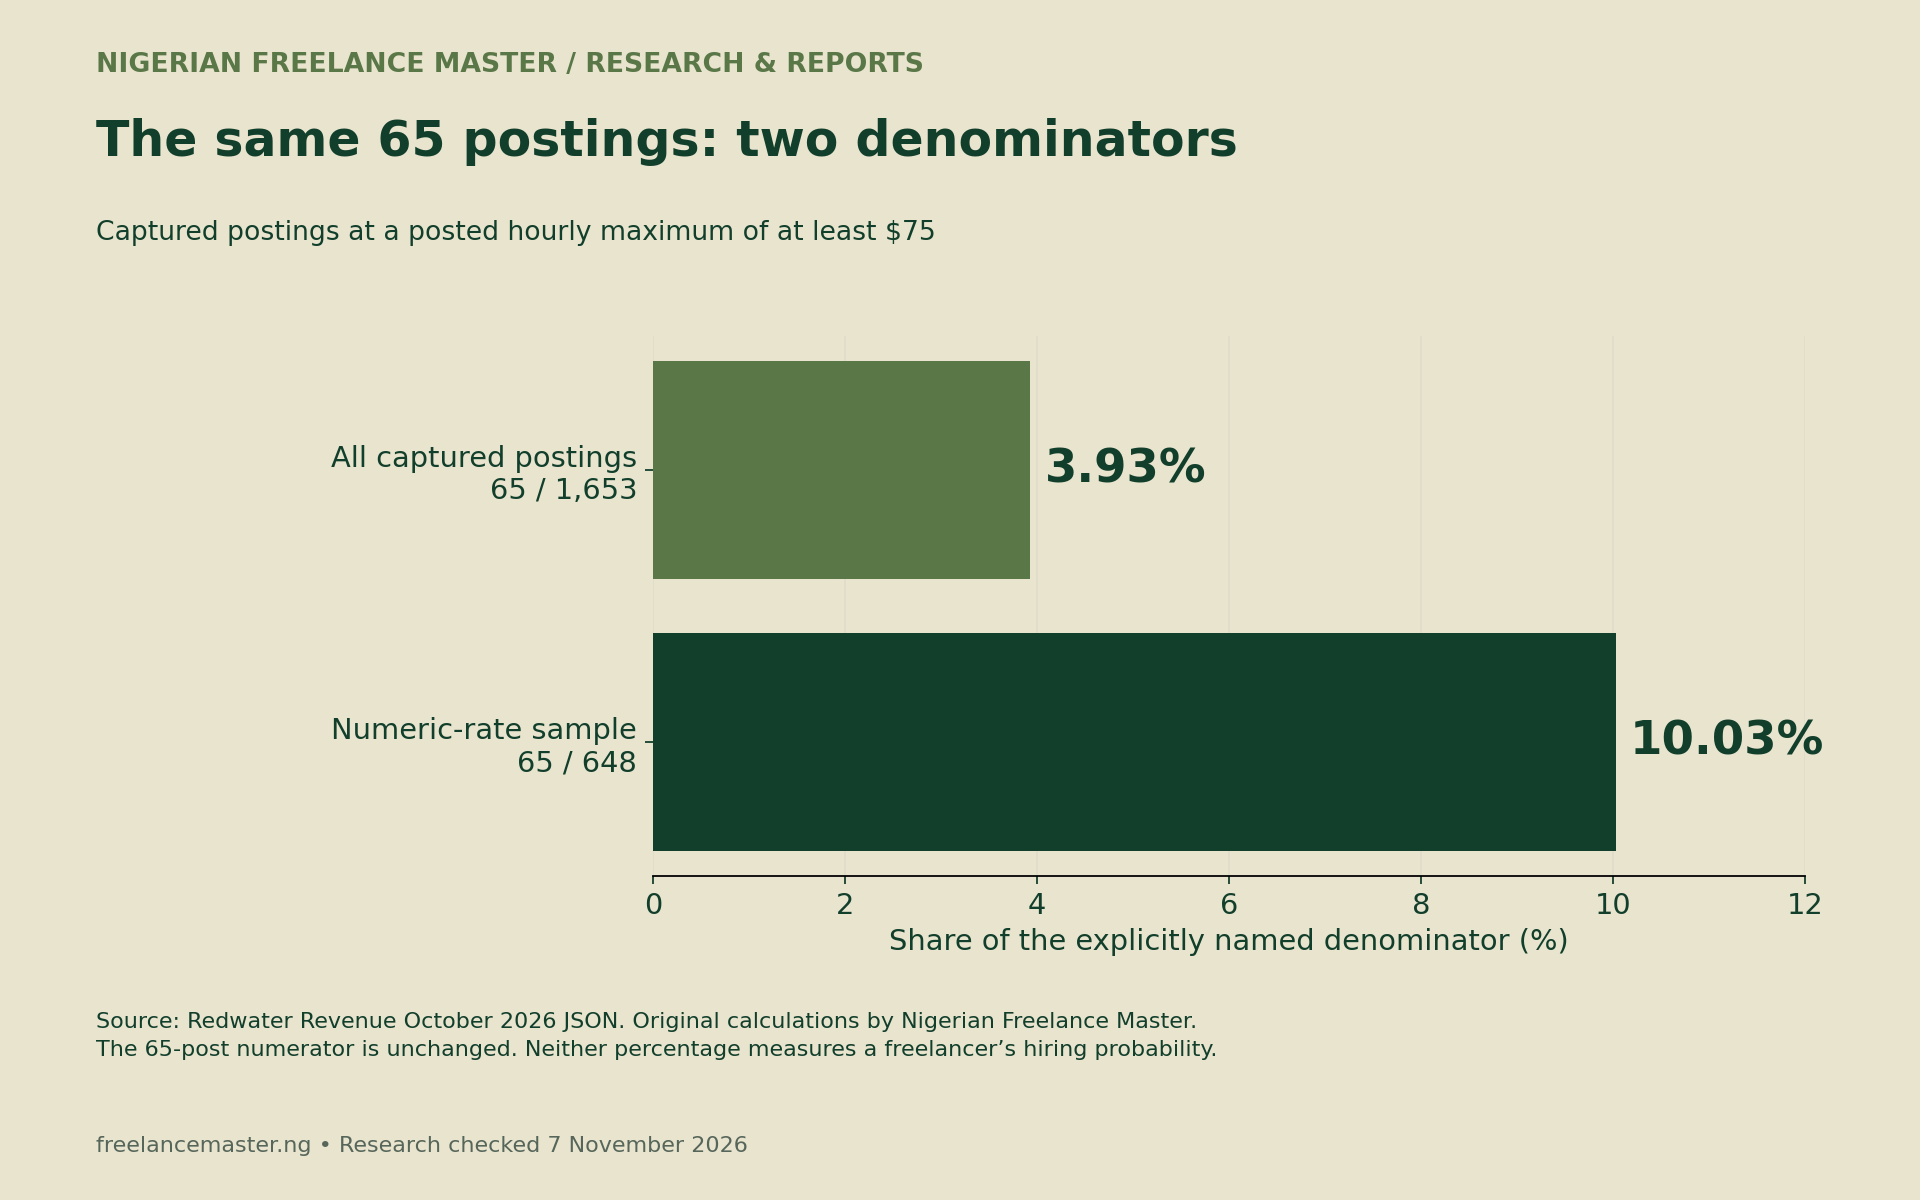
Use 3.93% when describing the share of the entire captured set. Use 10.03% when describing the share of the numeric-rate subset. Do not switch between them while presenting a trend. Also, neither tells you whether the client hired, negotiated a lower amount or completed payment.
For example, a freelancer might read 10.03% and assume roughly one in ten applications will succeed at that rate. The dataset does not support that inference. It contains no matching application denominator, applicant comparison or confirmed hiring outcome for that calculation.
Median, mean and quartiles describe posted ceilings
The October summary gives a median of $30 per hour and a mean of $39.86. Its 25th and 75th percentiles are $20 and $50. Those quartiles describe the middle half of the reported numeric sample. They are not the minimum and maximum; the publisher reports a maximum posted rate of $500.
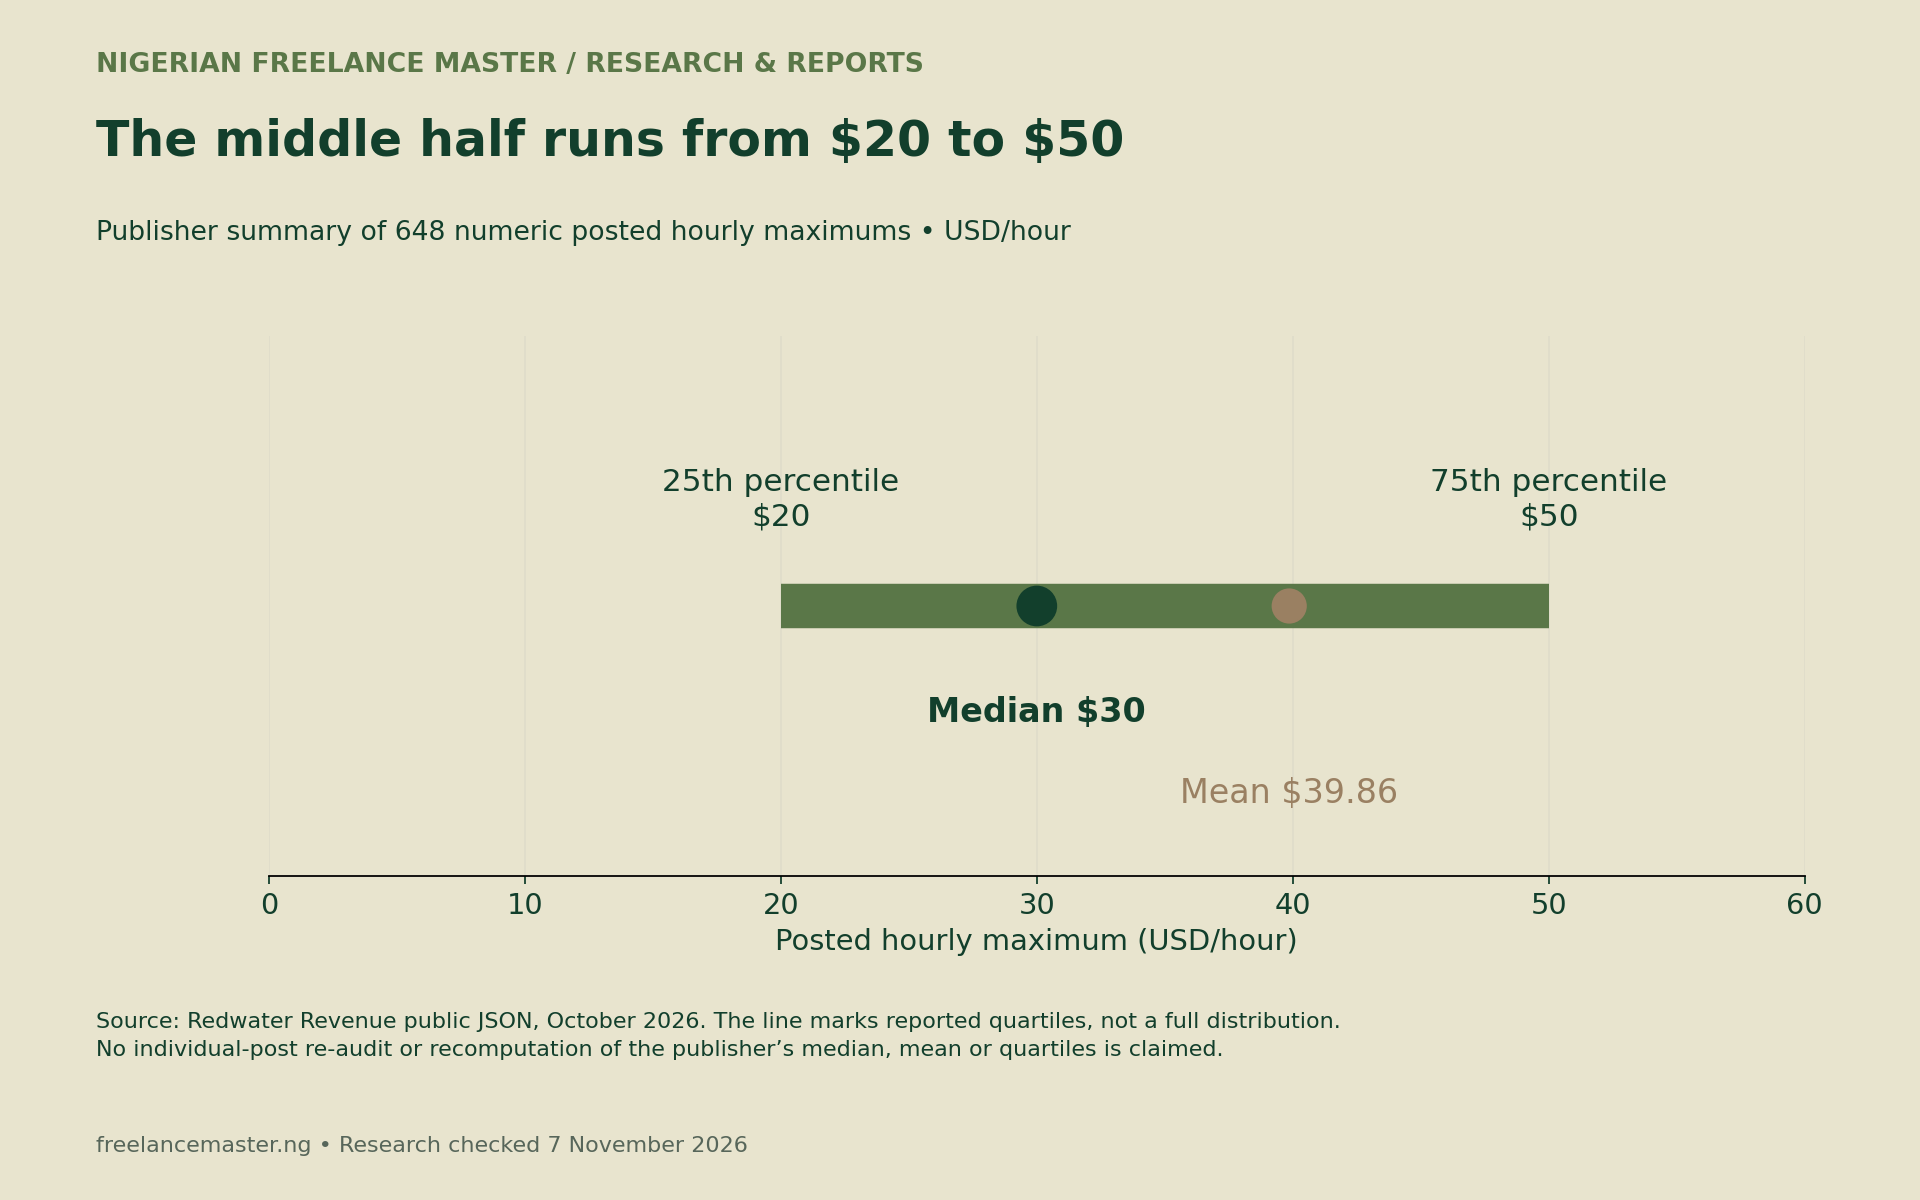
The mean exceeds the median by $9.86. That difference is consistent with a higher upper tail, but the aggregate file does not let us measure every observation’s influence. We do not reconstruct a histogram or claim to have independently audited the 648 individual rates.
Some publisher narrative describes what jobs “pay.” Its methodology is more precise: these are posted maximums. We use that definition throughout. A budget ceiling is an indication of the advertised range, while an agreed price and a realised receipt require separate evidence.
Turn Upwork automation rates into a scope-specific quote
Start with the task, rather than copying the median into a proposal. Identify the source system, destination system and required trigger. Then define the outputs, error handling and acceptance checks. Record who supplies access, test data and any paid software accounts.
A useful bounded example is one approved form-to-CRM workflow with specified fields and a named test set. It differs from an open request to automate an entire business. Clarify maintenance, monitoring, revisions and handover separately. Otherwise, the same hourly figure can describe very different commitments.
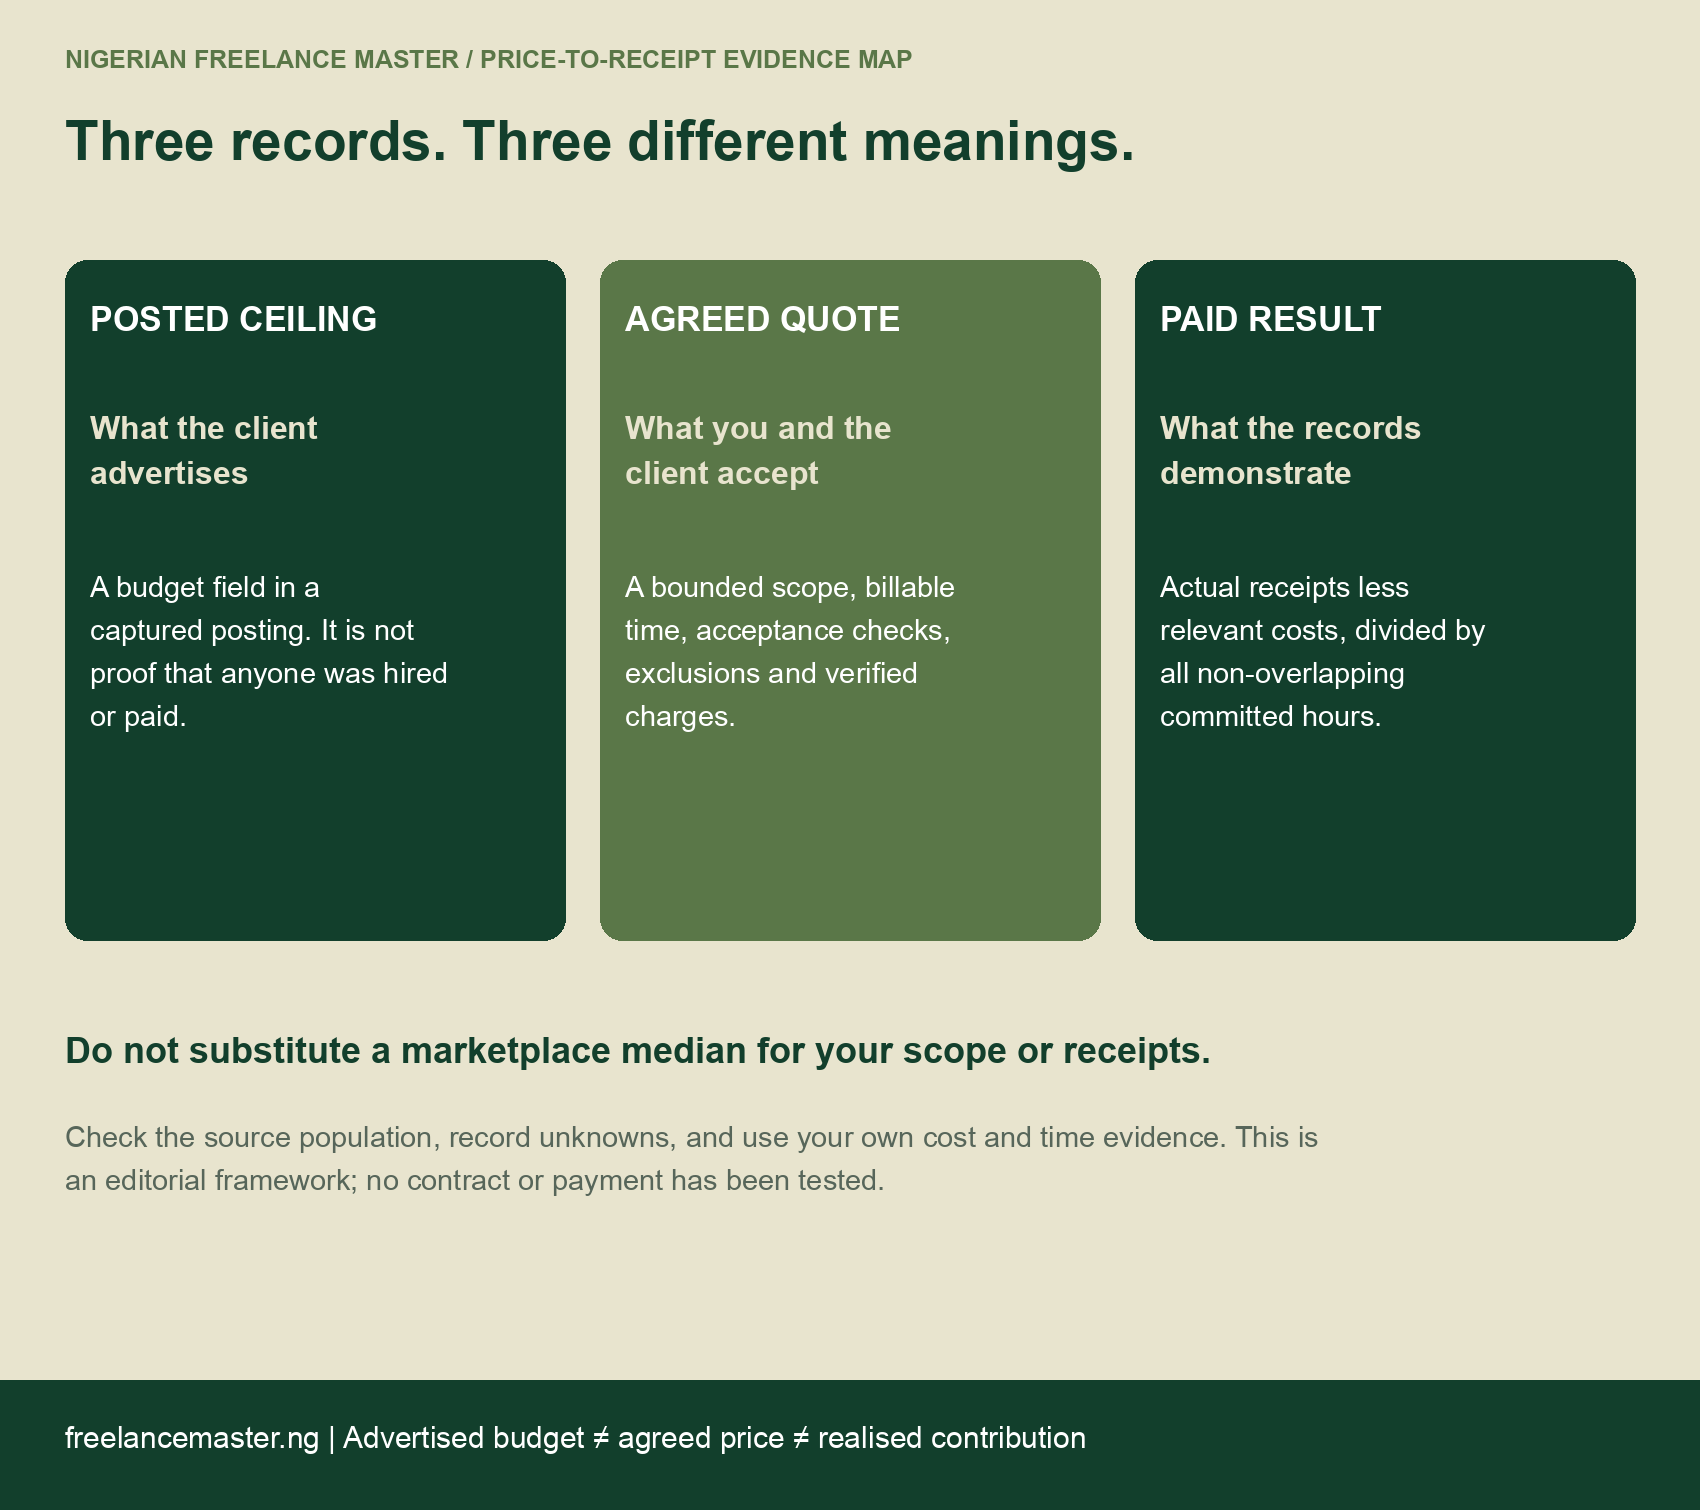
Next, verify charges for the actual opportunity. Upwork’s fee guidance currently describes a freelancer service fee ranging from 0% to 15% per contract, with the applicable percentage displayed at proposal or offer stage. Do not assume one percentage applies to every contract.
Keep withdrawal charges, currency conversion, taxes and overheads as separate worksheet inputs. Record the date and source of any conversion quote. We have not supplied a current USD-to-naira conversion, because no actual withdrawal route or transaction was tested. Do not mix dollar receipts with naira costs without a documented conversion basis.
Fictional project: follow the contribution and the time
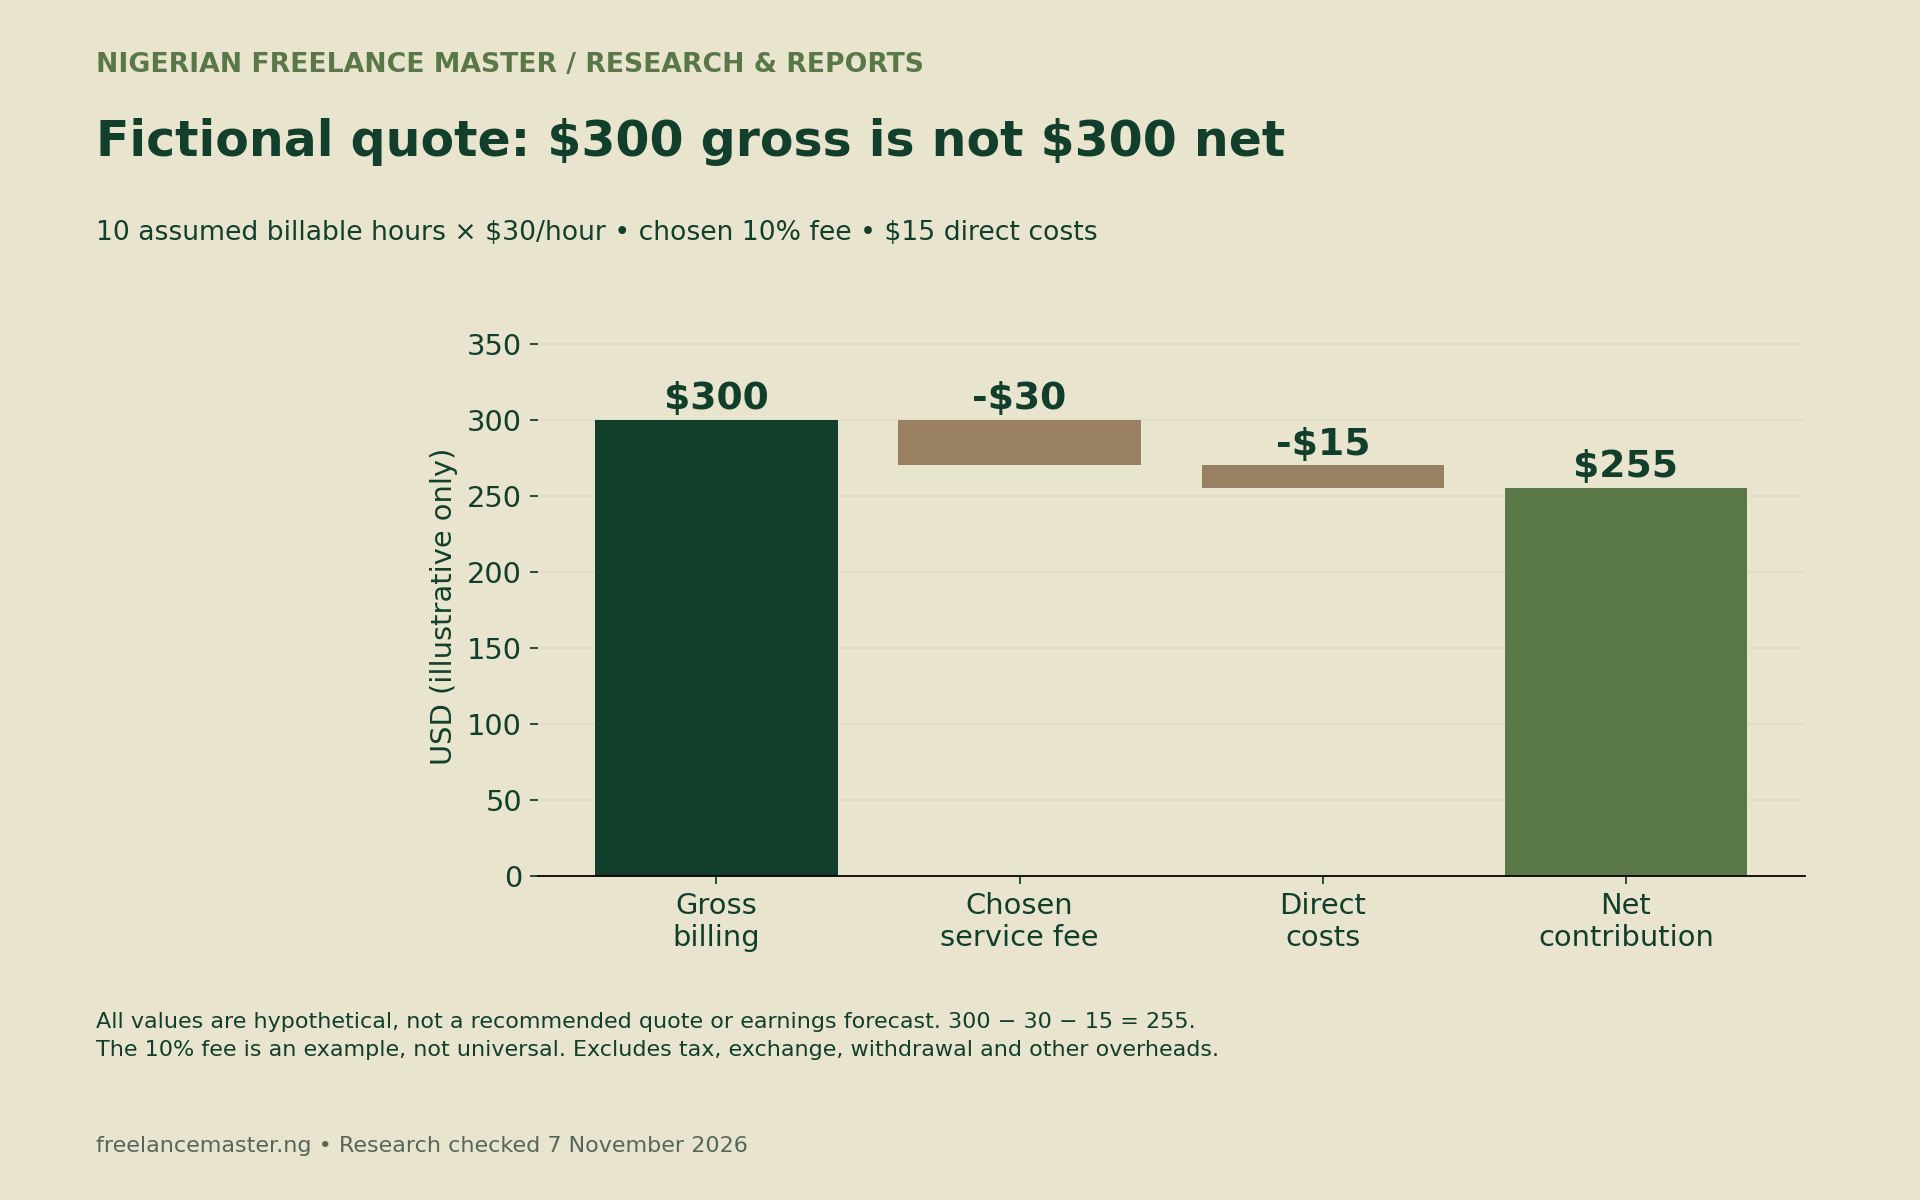
Consider an illustrative project with ten billable hours at an assumed $30 per hour. Gross billing would be $300. A chosen 10% service fee would be $30, and an assumed $15 of direct costs would leave $255 of contribution. Every value in this example is hypothetical. The 10% fee is a modelling input, not a universal platform rule.
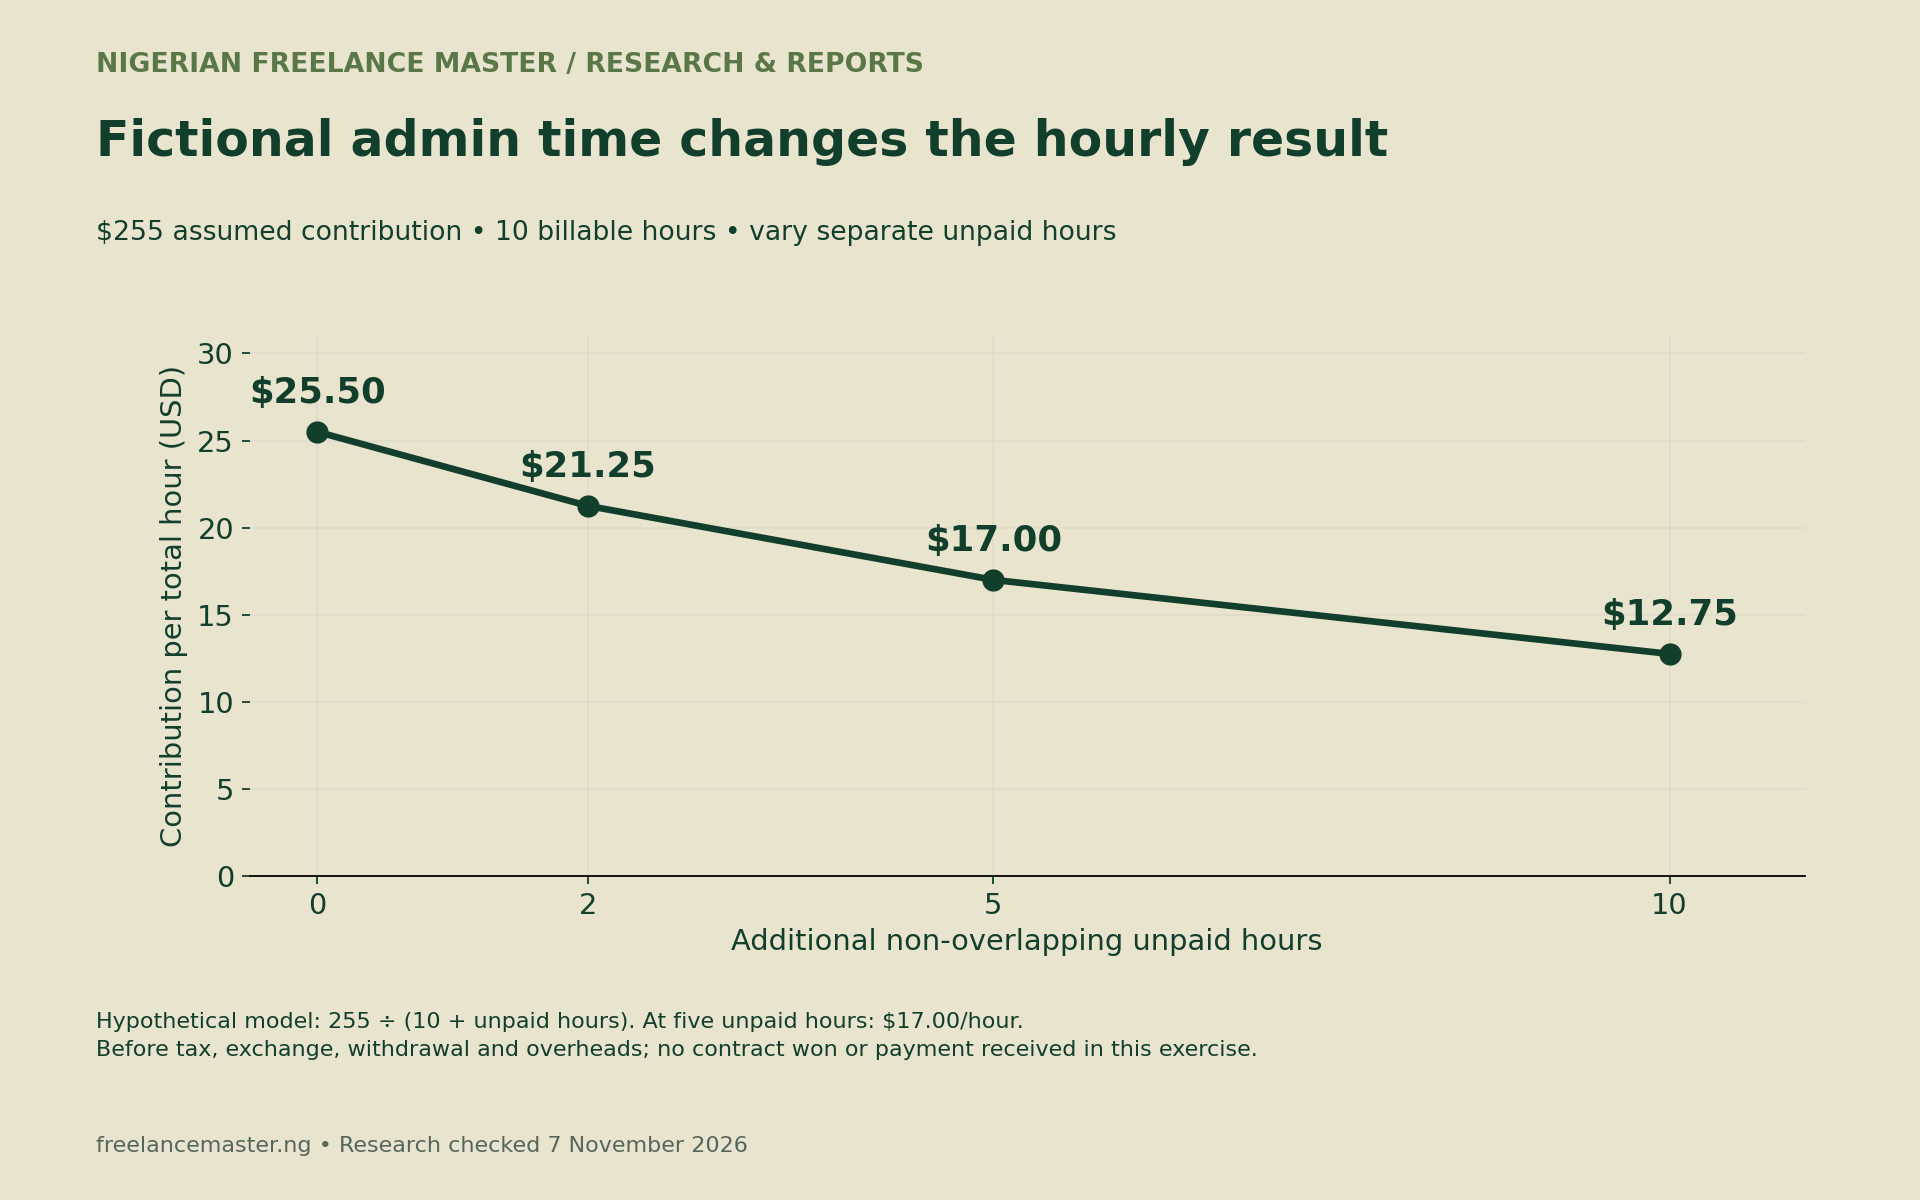
Now add five separate unpaid hours for scoping, administration and handover. Total committed time becomes fifteen hours. The illustrative contribution per total hour is $255 ÷ 15 = $17. That differs from the assumed $30 billing rate and excludes tax, exchange costs, withdrawal charges and other overheads.
Avoid counting the same hour twice. If administration happens during time already logged as committed work, classify it once. Our Upwork Now availability diary explains a related problem with exclusive standby time. Neither model assumes every available hour leads to a contract.
Download the data and blank quote worksheet
The downloads separate publisher aggregates, our calculations, blank planning fields and fictional assumptions. They contain no private client records. The blank worksheet does not automatically calculate cells; enter and check your own formulas in a spreadsheet application.
- October publisher-summary fields (CSV)
- Reproducible denominator calculations (CSV)
- Blank automation quote worksheet (CSV)
- Fictional quote and time-sensitivity inputs (CSV)
Before quoting, check eligibility, actual scope and evidence of your ability to deliver. Our training-selection scorecard can help identify a practical skill gap. After an actual client payment attempt, use individual transaction evidence; our payment continuity guide separates incident notices from a verified payment result.
Method, sources and limits of this analysis
Nigerian Freelance Master retained the publisher’s October JSON, CSV, methodology page, report and release feed on 7 November 2026. We checked the observation month, counts and definitions, then calculated 648 ÷ 1,653, 65 ÷ 1,653 and 65 ÷ 648. Results are rounded for display; the calculation CSV retains additional precision.
The publisher’s CSV is an aggregate export, not the underlying 1,653-post microdata. Our source-summary download selects aggregate fields and links back to the original JSON. We did not re-scrape Upwork, re-audit individual postings or reproduce the median and quartiles from raw rates. The publisher also identifies AI-generated narrative, which we do not treat as proof of paid outcomes.
Collection changes across the publisher’s longer series limit raw-count comparisons. This article stays with October rather than presenting an unsupported market growth trend. It also makes no platform ranking, Nigerian earnings estimate, client-conversion forecast or assurance that a premium advertised budget remains available.
Use the Upwork automation rates figures as dated research context. A sound quote still needs a bounded deliverable, verified charges and your own time assumptions. A claim about realised contribution needs actual receipts and costs after the work, rather than a price field in someone else’s advertisement.